

Saving 1.5 hours per day in manual checks with a real-time status dashboard
Sekisui House Australia


Sekisui House Australia, a major construction company, had launched a digital transformation and cloud-first strategy. As part of this, they needed a way to monitor their hybrid cloud environment, spanning on-prem systems, Azure infrastructure, and multiple third-party SaaS tools.
At the time, teams were spending up to 2 hours each morning manually logging into 8 different systems to check service statuses and performance.

Construction

200+ employees

8 separate IT systems

Main outcome
Real-time visibility of 8 key systems in a single, time-saving dashboard

Implementation time
6 months

Maturity level
From Level 1 (Reactive) to Level 3 (Proactive)


This project advanced monitoring from Level 1 (Reactive) to Level 3 (Proactive).
1
Reactive
Manual monitoring across multiple systems with no alerting and no dashboards set up.
2
Responsive
Basic monitoring and predefined alerts set up for some systems but no dashboards yet.
3
Proactive
Total system observability with some dashboards and automated diagnostic alerts.
4
Predictive
Full observability across all systems with leading metric tracking for predictive alerts.
5
Strategic
Observability fully integrated with intelligence systems to provide business insights.
The challenge: Getting data from systems without APIs
Sekisui House wanted a single dashboard to monitor their full environment, including Azure, Cisco Meraki, and several SaaS applications. The goal was to save 1-2 hours a day in manual checks.
The challenge? Not all systems exposed a public API, which meant standard integrations weren’t always possible.
This is a common roadblock for IT teams. When some platforms offer APIs and others don’t, visibility becomes fragmented. Some systems can be connected directly, while others act like “black boxes” with no clear way to track performance.
As a result, teams waste time on manual checks, and worse, take longer to detect issues due to a lack of alerting.
The solution: Combining APIs with synthetic monitoring
We worked closely with Sekisui House to define the key metrics they needed from each system.
Where APIs were available, we built custom API monitors in SolarWinds to map system responses into clear status indicators: green, amber, or red.
For systems without accessible APIs, we used synthetic transactions to simulate real user actions. This meant SolarWinds could automatically perform the same manual checks staff were doing and display the results in the dashboard - no native integrations required.
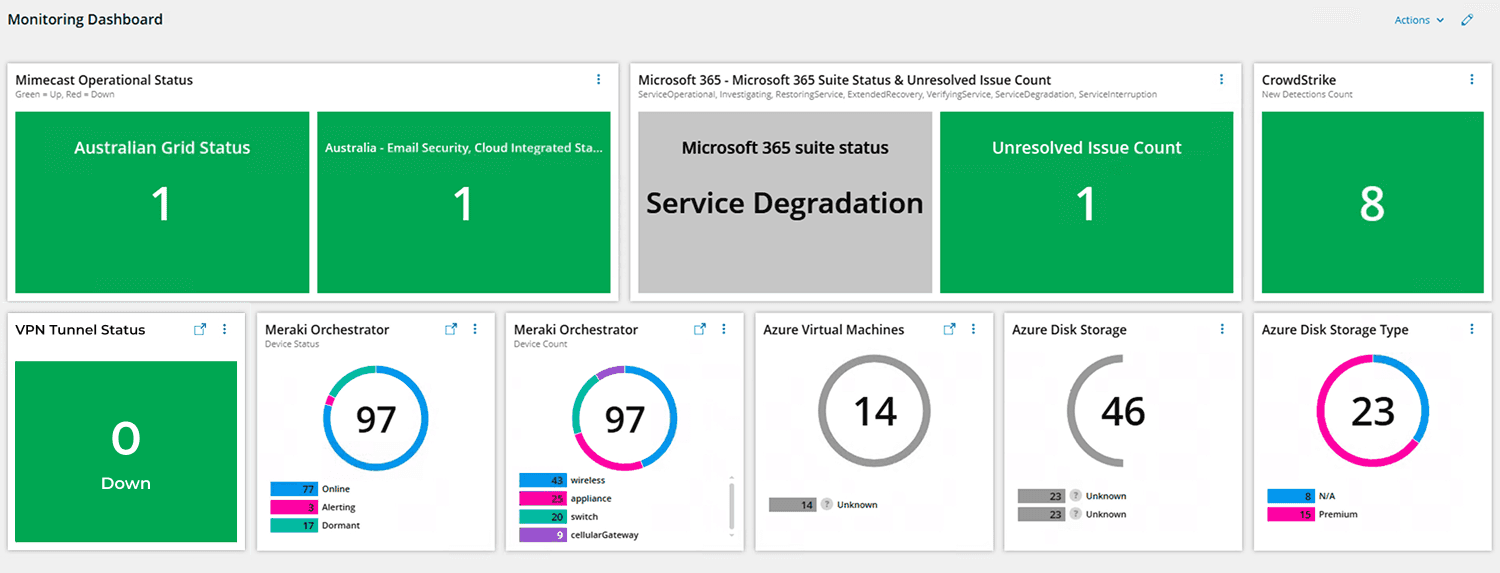
Everything was then surfaced in a clean, modern status dashboard, giving instant visibility across all eight services (see below).
Final status dashboard
The final outcomes
This project:
Unified monitoring across Azure, Cisco Meraki, and multiple other SaaS platforms.
Saved 7.5 hours per week by eliminating manual checks ($20k/yr at annual salary of $100k).
Improved response times thanks to real-time alerting.
Removed system blind spots. Even systems without public APIs now had status visibility.
Improved operational maturity from reactive checks to proactive insights.
The key insight
Using a combination of synthetic monitoring that mimics manual human checks and automated API integration, teams can achieve end-to-end visibility, even in environments that initially seem impossible to monitor.

Our processes are now streamlined
“We have been collaborating with Intrepid to optimise our SolarWinds dashboard and integrate APIs with cloud workloads. The process has been highly effective, resulting in a more streamlined experience and a deeper understanding of the SolarWinds platform.”
Jim, Senior System Engineer
Sekisui House


