

From monitoring silos to business-wide observability in 6 months
Queensland local government


This local government manages a complex hybrid environment spanning both corporate IT systems and operational infrastructure.
Their corporate network includes key systems such as workforce management, a local government ERP (Pathway), and digital services for residents, most of which are hosted on-premise, with some workloads in the cloud.
In parallel, they operate a critical SCADA network that controls essential utilities like water treatment, sewage, and public infrastructure.
Before this project, only the network team had mature monitoring in place. Other teams, including infrastructure, applications, and OT, had limited visibility and relied on manual processes.

Local government

1,000+ employees

1,500+ monitored entities

Main outcome
End-to-end observability across corporate and SCADA systems via a single SolarWinds platform

Implementation time
6 months

Maturity level
From Level 2 (Responsive) to Level 3 (Proactive)


This project advanced monitoring from Level 2 (Responsive) to Level 3 (Proactive).
1
Reactive
Manual monitoring across multiple systems with no alerting and no dashboards set up.
2
Responsive
Basic monitoring and predefined alerts set up for some systems but no dashboards yet.
3
Proactive
Total system observability with some dashboards and automated diagnostic alerts.
4
Predictive
Full observability across all systems with leading metric tracking for predictive alerts.
5
Strategic
Observability fully integrated with intelligence systems to provide business insights.
The challenge: Structuring monitoring for the whole business
The local council had SolarWinds in place, but only within the network team (level 3 maturity). The rest of the business, including infrastructure and application teams, operated in silos, with no shared visibility or consistent alerts (level 1 maturity).
The challenge wasn’t pulling in more data; it was structuring that data in a way that could scale across teams and systems, and deliver on business use cases.
It’s easy to adopt a “what do we need right now?” mindset and label devices for immediate needs, without considering how those labels will support grouping, alerting, or dashboarding over time. This leads to a fragmented platform that’s hard to scale as more teams and systems come online.
What was needed wasn’t just broader monitoring, it was a structured data model aligned to how the business operates, enabling priority-based alerting, team-specific views, and organisation-wide reporting.
The solution: Business-driven monitoring architecture
We worked across teams to extend monitoring beyond the network layer to include servers, databases, and applications. We began with a full audit of the existing environment, keeping what worked, filling the gaps, and bringing everything under a unified data model.
This included:
Defining key business services (e.g. ERP, workforce management, utilities)
Creating alert tiers, so Priority 1 issues trigger alerts, while lower-tier issues show on dashboards
Mapping dependencies to monitor functional health, not just availability
Using custom properties and dynamic groups to structure by priority, team, and location
Building operational and executive dashboards designed for 3-click root cause analysis
One example of a final result is the monitoring of their ERP system, Pathway. We created a clean 7-tile summary showing the health of each major component (shown below). Clicking into any tile, like Pathway Presentation Servers, opens an application map with status overlays (also shown below). Each device can be explored further, with most issues diagnosable within three clicks.
7-tile status summary of their Pathway ERP application
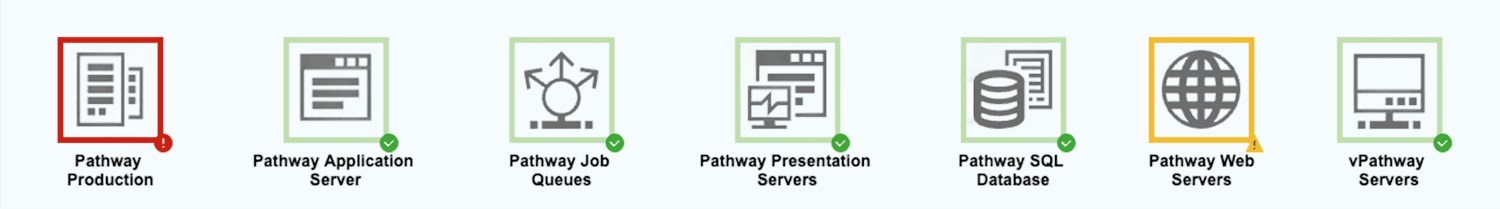
Application map shown when clicking Presentation Servers above
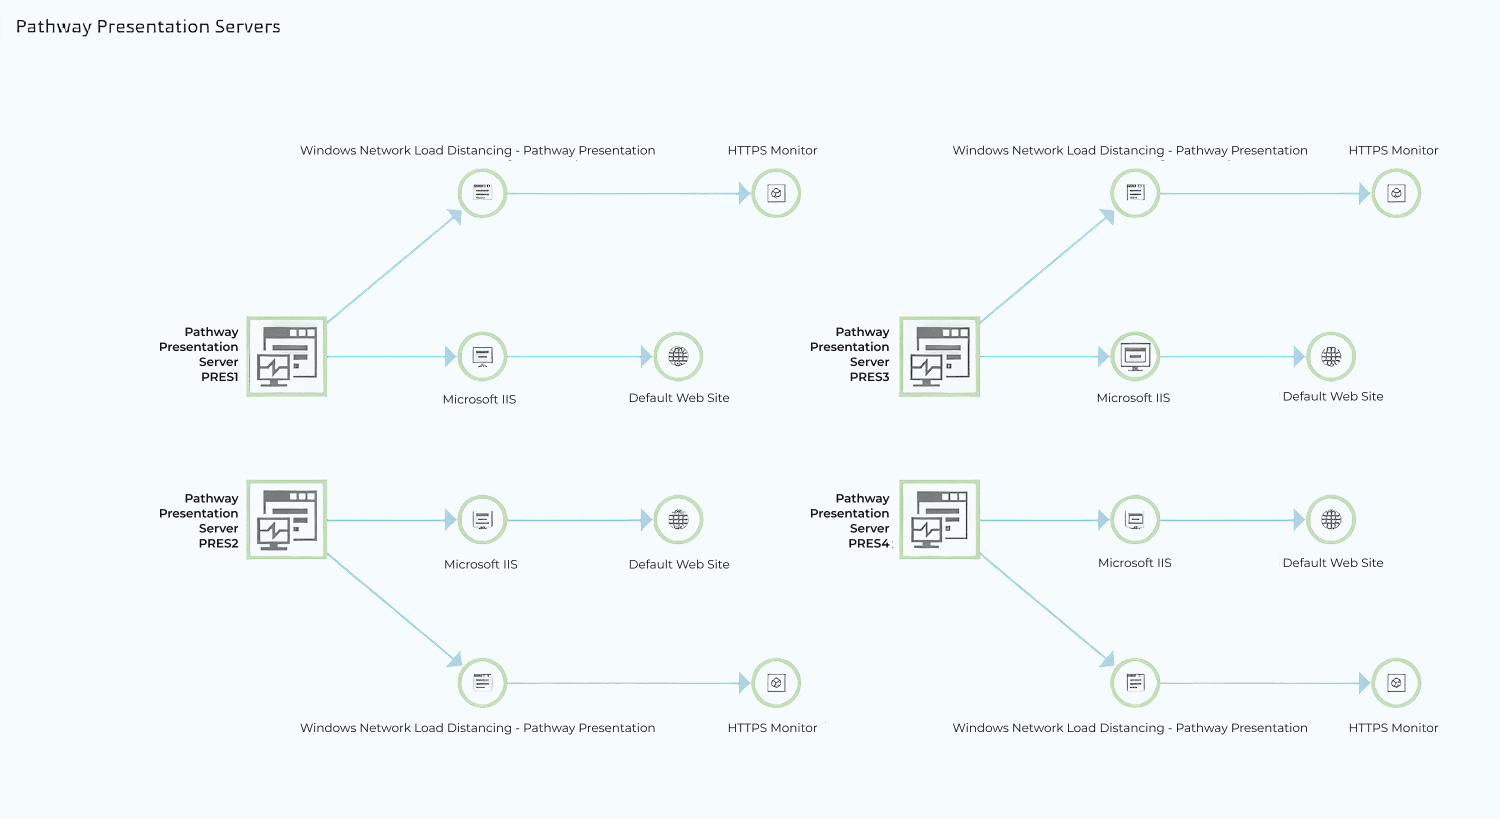
Sample images used for privacy reasons.
The final outcomes
This project:
Enabled full-stack visibility across network, servers, databases, applications, and ERP
Unified all teams under one platform with no more silos
Gave technical teams and execs their own role-specific dashboards
Structured alerting by priority, so teams act on what matters
Sped up troubleshooting, with issues diagnosable within three clicks
Improved business continuity for systems tied to 70%+ of council revenue
The key insight
What's often missing isn't comprehensive monitoring data from all systems, it's the framework for how to group, prioritise, and display it. Without structure, alerts overwhelm, dashboards lose clarity, and teams stay reactive.

Our comprehensive visibility is invaluable
“...Both our Network and Infrastructure teams can now efficiently monitor, alert, and track system performance in real-time. The comprehensive visibility provided by SolarWinds across our entire IT ecosystem has been invaluable. The advanced performance monitoring and improved alert management have allowed us to address potential issues promptly, reducing downtime and enhancing overall system reliability.”
Melissa, Infrastructure and Apps Team
Queensland local government


